1. Overview
Mid/Side (M/S) decoding analysis of Suno AI’s WAV mix-down output reveals significant energy attenuation above 5kHz in the Side channel (stereo difference signal). This attenuation pattern was consistently observed across all Suno output samples and was absent from reference material produced through conventional DAW workflows.
The rolloff between the 1–5kHz band and frequencies above 15kHz measured 38.6–42.2 dB across Suno samples — behavior consistent with MP3 128kbps joint stereo encoding. Notably, this degradation does not occur when the same track is exported via Suno’s Studio stem separation feature.
This report examines two possible explanations: structural characteristics of the internal neural audio codec (measurement-based inference), and intentional fingerprint embedding (circumstantial hypothesis). The latter is supported by a temporal correlation with increased compression artifacts around the November 2025 Warner Music Group partnership announcement.
2. Methodology
2.1 Test Materials
| ID | Source | Description |
|---|---|---|
| suno_01 | Suno AI mix output | Electro Rock × J-Pop track, chorus section, 36s |
| suno_02 | Suno AI mix output | Separate track, dense arrangement section, 36s |
| suno_03 | Suno AI mix output | Separate track, full band section, 36s |
| original_01 | Conventional DAW production | Mastered stereo mix, comparable density, 36s |
| original_02 | Conventional DAW production | Pre-master stereo mix, comparable density, 36s |
All files: 48kHz / 24-bit / Stereo WAV
2.2 Analysis Method
- M/S Decoding: Mid = (L+R)/2, Side = (L-R)/2 computed from L/R channels
- RMS Level Measurement: Peak and RMS values in dBFS for Mid/Side channels
- Band Energy Analysis: Energy distribution across 8 frequency bands (20Hz–20kHz)
- Spectral Rolloff: Energy differential between 1–5kHz and 15kHz+ bands
- Stereo Width Ratio: Side/Mid RMS ratio in dB
Analysis performed in Python (NumPy + SciPy + SoundFile). Hanning-windowed FFT applied to a 10-second segment from the center of each file.
2.5 Corpus-Scale Statistical Analysis
In addition to the individual sample tests above, a corpus-scale statistical analysis was conducted across 3,571 tracks generated with Suno AI’s v5 model (duration >= 30s, type=gen).
Corpus Overview
| Metric | Value |
|---|---|
| Total analyzed tracks | 4,237 |
| v5 generation tracks (primary subset) | 3,571 |
| Same-generation event pairs | 1,549 |
Primary Subset Medians
| Metric | Median |
|---|---|
| LUFS-I | -13.81 |
| Stereo correlation | 0.848 |
| Side/Mid width | -10.83 dB |
| Side rolloff (1–3kHz vs 8–20kHz) | 10.34 dB |
| Mid rolloff (1–3kHz vs 8–20kHz) | 8.50 dB |
| Side-Mid gap at 1–3kHz | -8.97 dB |
| Side-Mid gap at 8–12kHz | -10.69 dB |
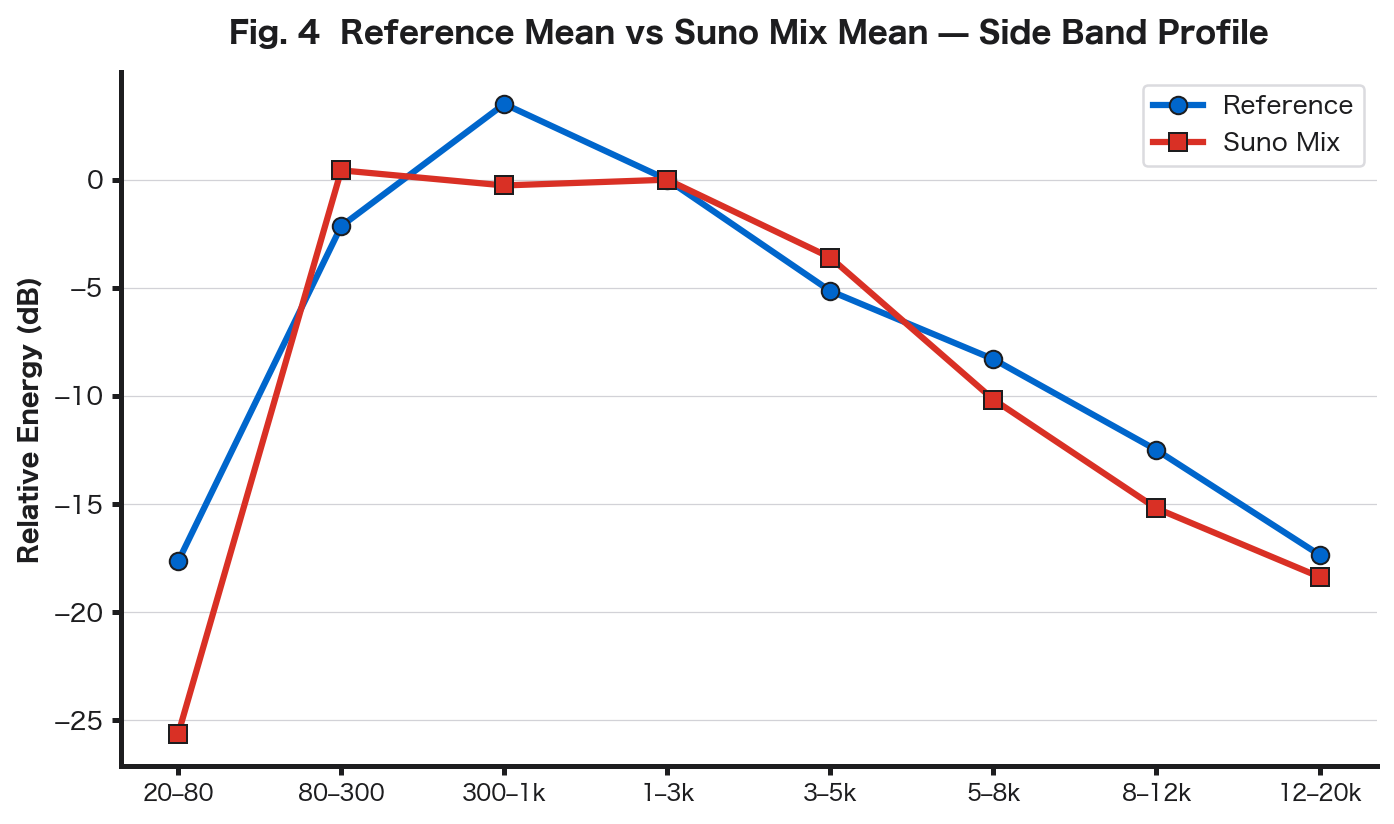
Notable: The corpus-wide median Side/Mid width of -10.83 dB across 3,571 tracks corroborates that Side channel degradation is a systematic characteristic of all Suno v5 output, not an artifact of individual sample selection.
Task-Level Differences
| Task | n | Side/Mid Width (median) | Side Rolloff (median) |
|---|---|---|---|
| cover | 1,287 | -11.05 dB | 10.52 dB |
| artist_cover | 953 | -10.55 dB | 10.41 dB |
| artist_consistency | 227 | -10.28 dB | 10.67 dB |
| playlist_condition | 155 | -10.63 dB | 10.23 dB |
| mashup_condition | 150 | -13.19 dB | 6.99 dB |
Note: mashup_condition shows a materially different distribution (narrower stereo, LUFS-I at -16.17 dB). Pooled cross-task statistics should not be treated as a homogeneous distribution.
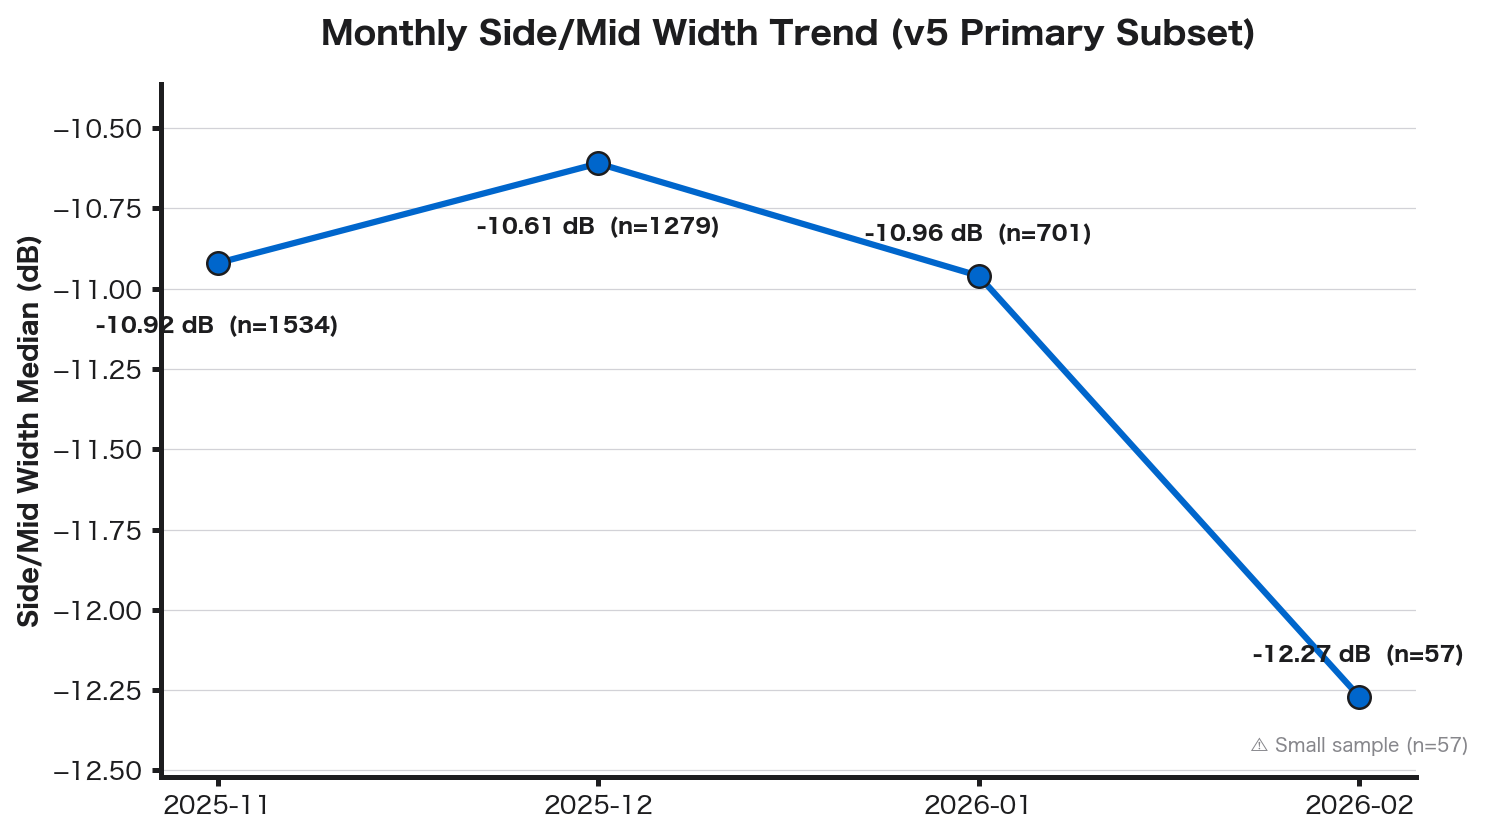
Monthly Trends
| Month | n | Side/Mid Width (median) | Side Rolloff (median) |
|---|---|---|---|
| 2025-11 | 1,534 | -10.92 dB | 10.62 dB |
| 2025-12 | 1,279 | -10.61 dB | 10.35 dB |
| 2026-01 | 701 | -10.96 dB | 9.93 dB |
| 2026-02 | 57 | -12.27 dB | 7.13 dB |
Note: February 2026 data is small (n=57) and biased toward mashup_condition. The November 2025 to January 2026 range shows stable values of -10.6 to -11.0 dB.
Same-Generation Pair Variability
Comparison of two outputs from the same generation event (n=1,549 pairs):
| Metric | Mean Diff | Median Diff | P90 Diff |
|---|---|---|---|
| LUFS-I | 0.98 dB | 0.81 dB | 1.97 dB |
| Stereo correlation | 0.071 | 0.055 | 0.147 |
| Side/Mid width | 2.15 dB | 1.77 dB | 4.29 dB |
| Side rolloff | 4.48 dB | 3.58 dB | 9.43 dB |
Notable: Even with identical prompts, Side/Mid width varies by a median of 1.77 dB and P90 of 4.29 dB, indicating that Suno’s stereo processing pipeline is non-deterministic.
3. Measurement Results
Note: All values in this section are objective measurements without interpretation.
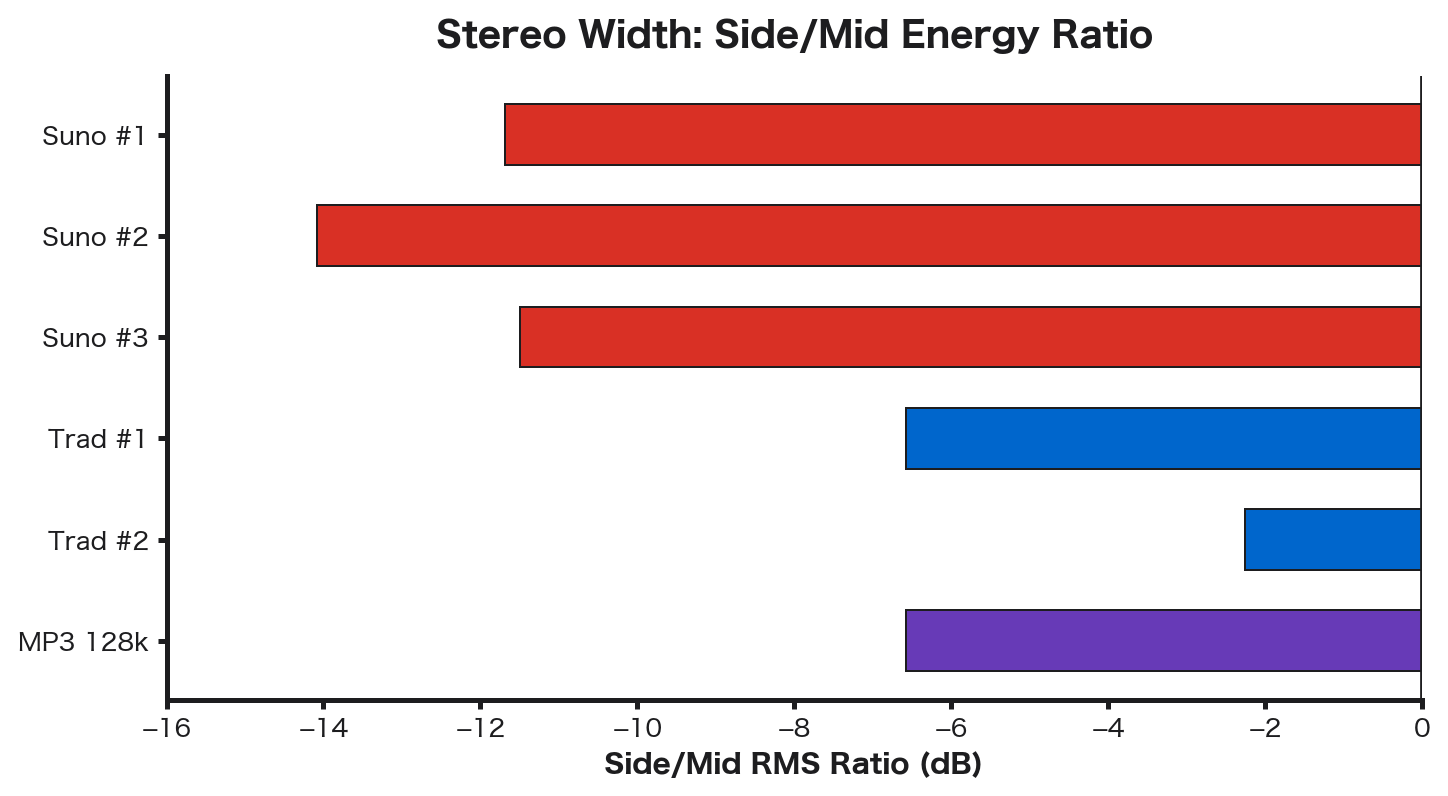
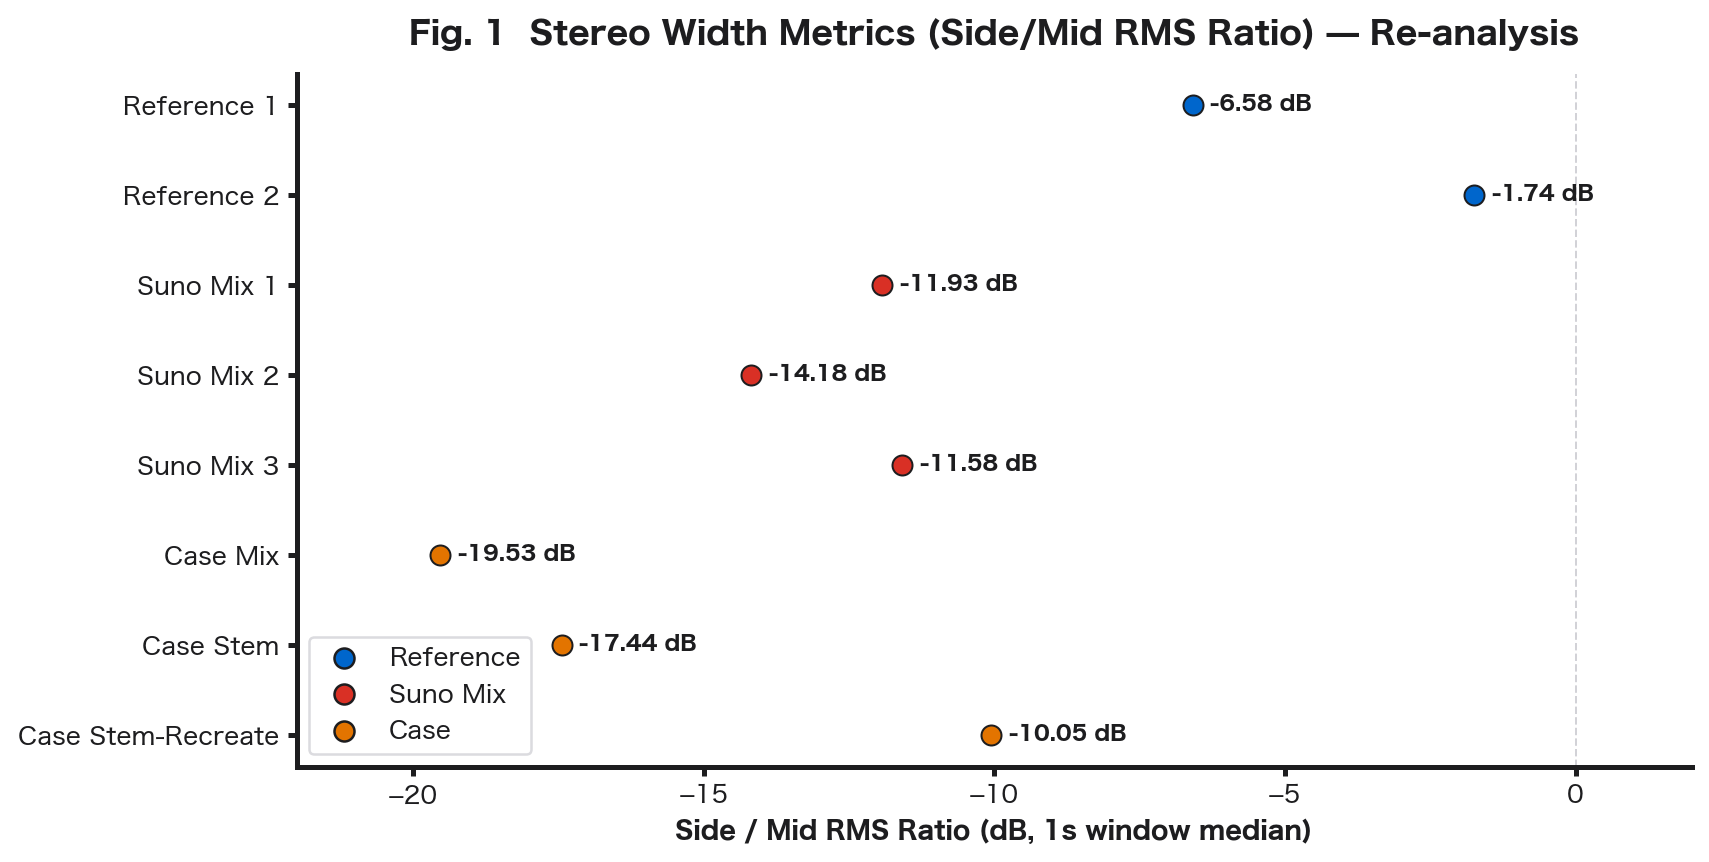
3.1 Stereo Width (Side/Mid RMS Ratio)
| Sample | Side/Mid Ratio | Classification |
|---|---|---|
| suno_01 | -11.69 dB | Suno output |
| suno_02 | -14.08 dB | Suno output |
| suno_03 | -11.49 dB | Suno output |
| original_01 | -6.58 dB | DAW production |
| original_02 | -2.26 dB | DAW production |
| mp3_128 | -6.57 dB | MP3 128kbps reference |
Suno output Side levels are 5–12 dB lower than conventional productions.
Of note: MP3 128kbps shows steep rolloff (48.1 dB) but preserves stereo width (Side/Mid ratio: -6.57 dB) nearly identical to the original. Suno output exhibits rolloff AND lower overall Side energy — a fundamentally different degradation mechanism from MP3 joint stereo.
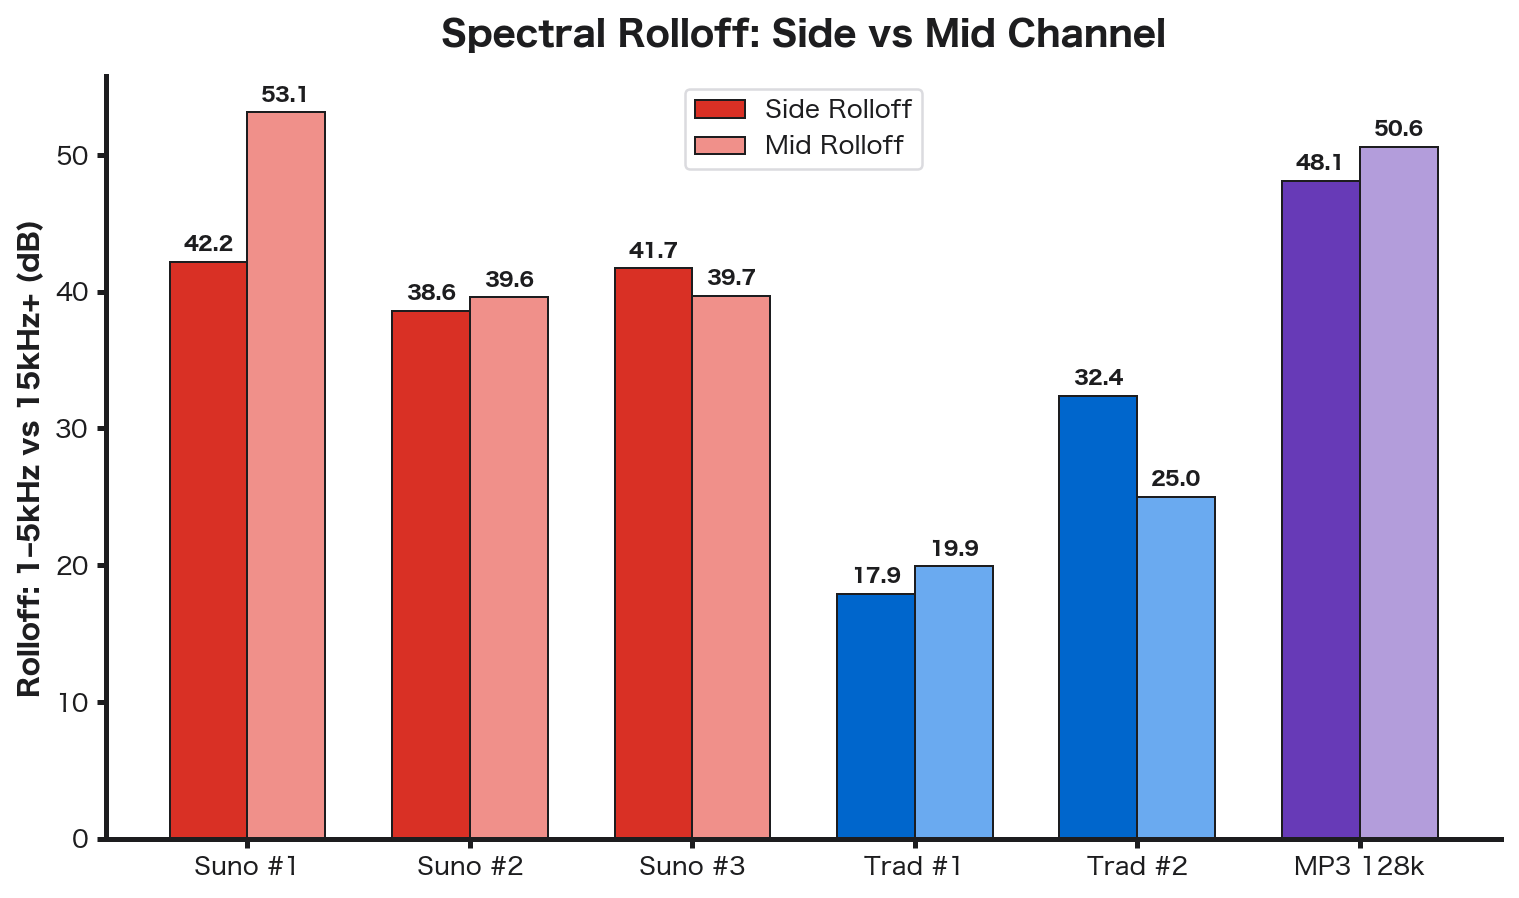
3.2 Side Channel Spectral Rolloff
| Sample | Side Rolloff | Mid Rolloff | Delta (Side − Mid) |
|---|---|---|---|
| suno_01 | 42.2 dB | 53.1 dB | -10.9 dB |
| suno_02 | 38.6 dB | 39.6 dB | -1.0 dB |
| suno_03 | 41.7 dB | 39.7 dB | +2.0 dB |
| original_01 | 17.9 dB | 19.9 dB | -2.0 dB |
| original_02 | 32.4 dB | 25.0 dB | +7.4 dB |
| mp3_128 | 48.1 dB | 50.6 dB | -2.5 dB |
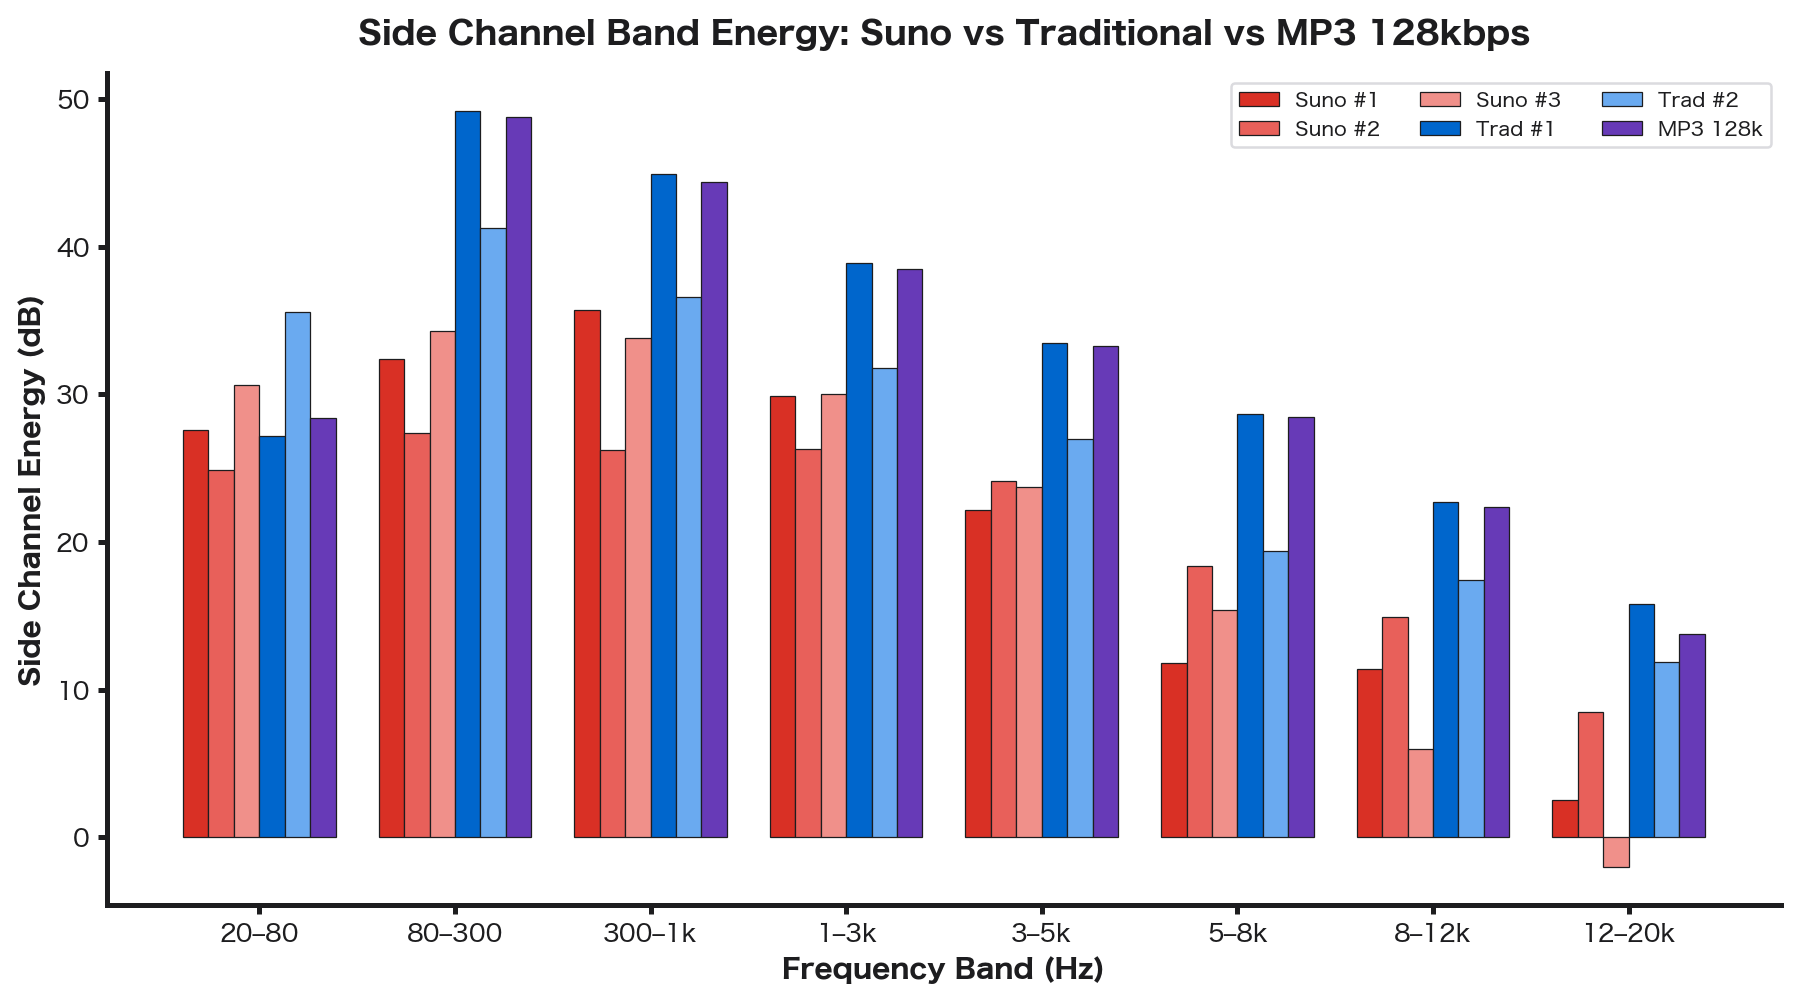
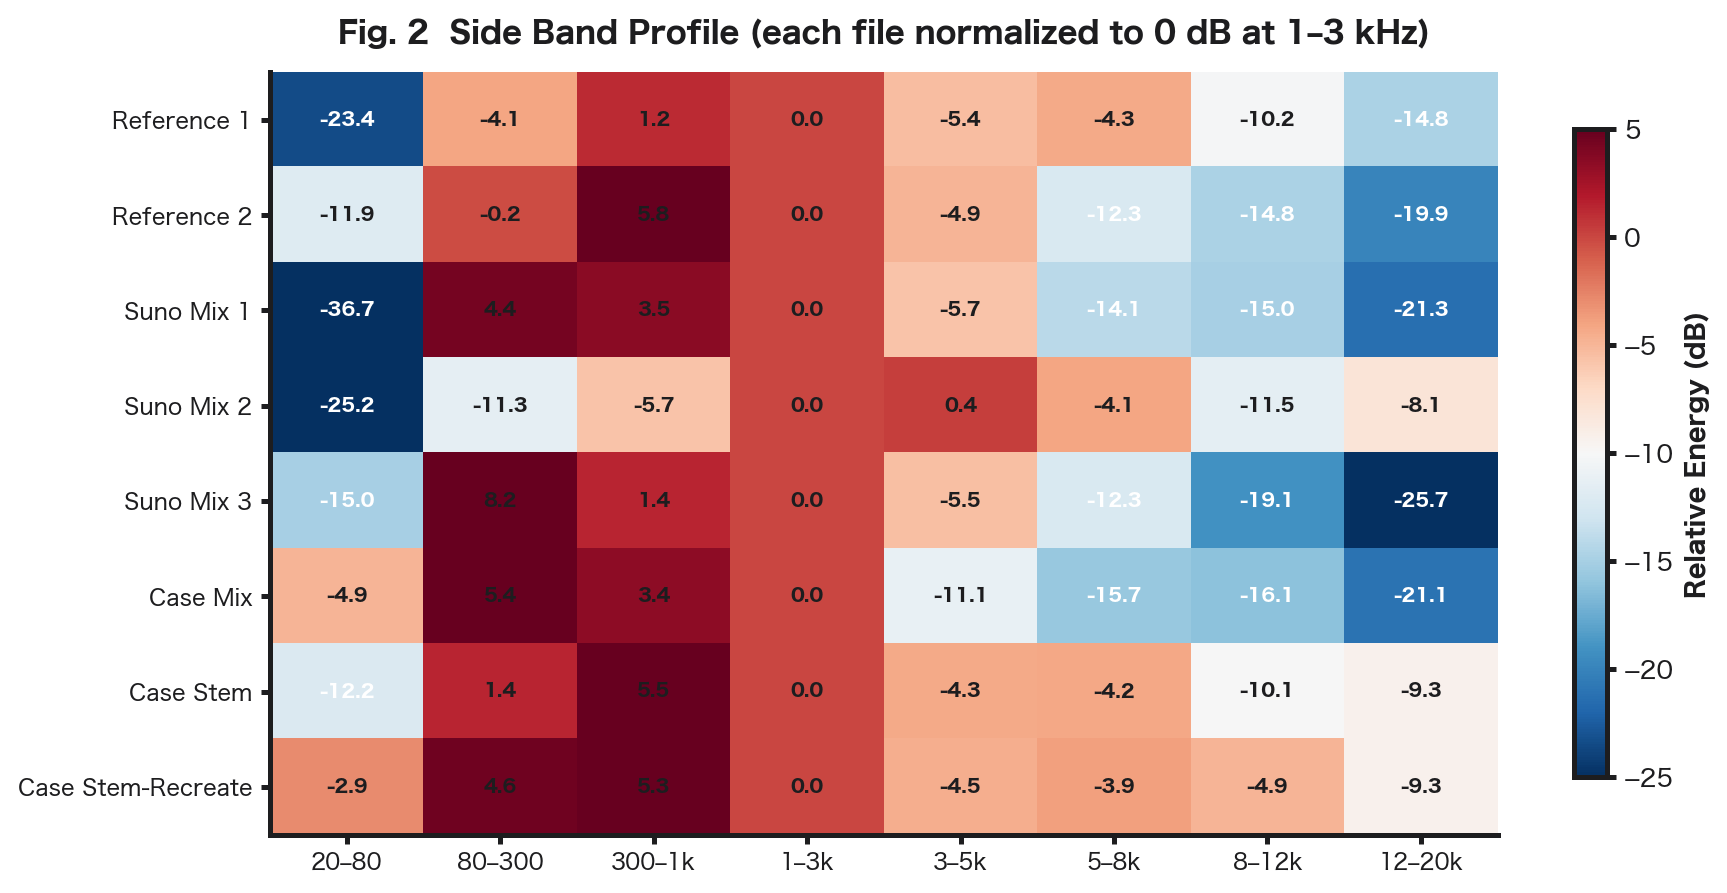
3.3 Side Channel Band Energy (dB)
| Band | suno_01 | suno_02 | suno_03 | original_01 | original_02 | mp3_128 |
|---|---|---|---|---|---|---|
| 20–80 Hz | 27.6 | 24.9 | 30.6 | 27.2 | 35.6 | 28.4 |
| 80–300 Hz | 32.4 | 27.4 | 34.3 | 49.2 | 41.3 | 48.8 |
| 300–1k Hz | 35.7 | 26.2 | 33.8 | 44.9 | 36.6 | 44.4 |
| 1–3k Hz | 29.9 | 26.3 | 30.0 | 38.9 | 31.8 | 38.5 |
| 3–5k Hz | 22.2 | 24.1 | 23.7 | 33.5 | 27.0 | 33.3 |
| 5–8k Hz | 11.8 | 18.4 | 15.4 | 28.7 | 19.4 | 28.5 |
| 8–12k Hz | 11.4 | 14.9 | 6.0 | 22.7 | 17.4 | 22.4 |
| 12–20k Hz | 2.5 | 8.5 | -2.0 | 15.8 | 11.9 | 13.8 |
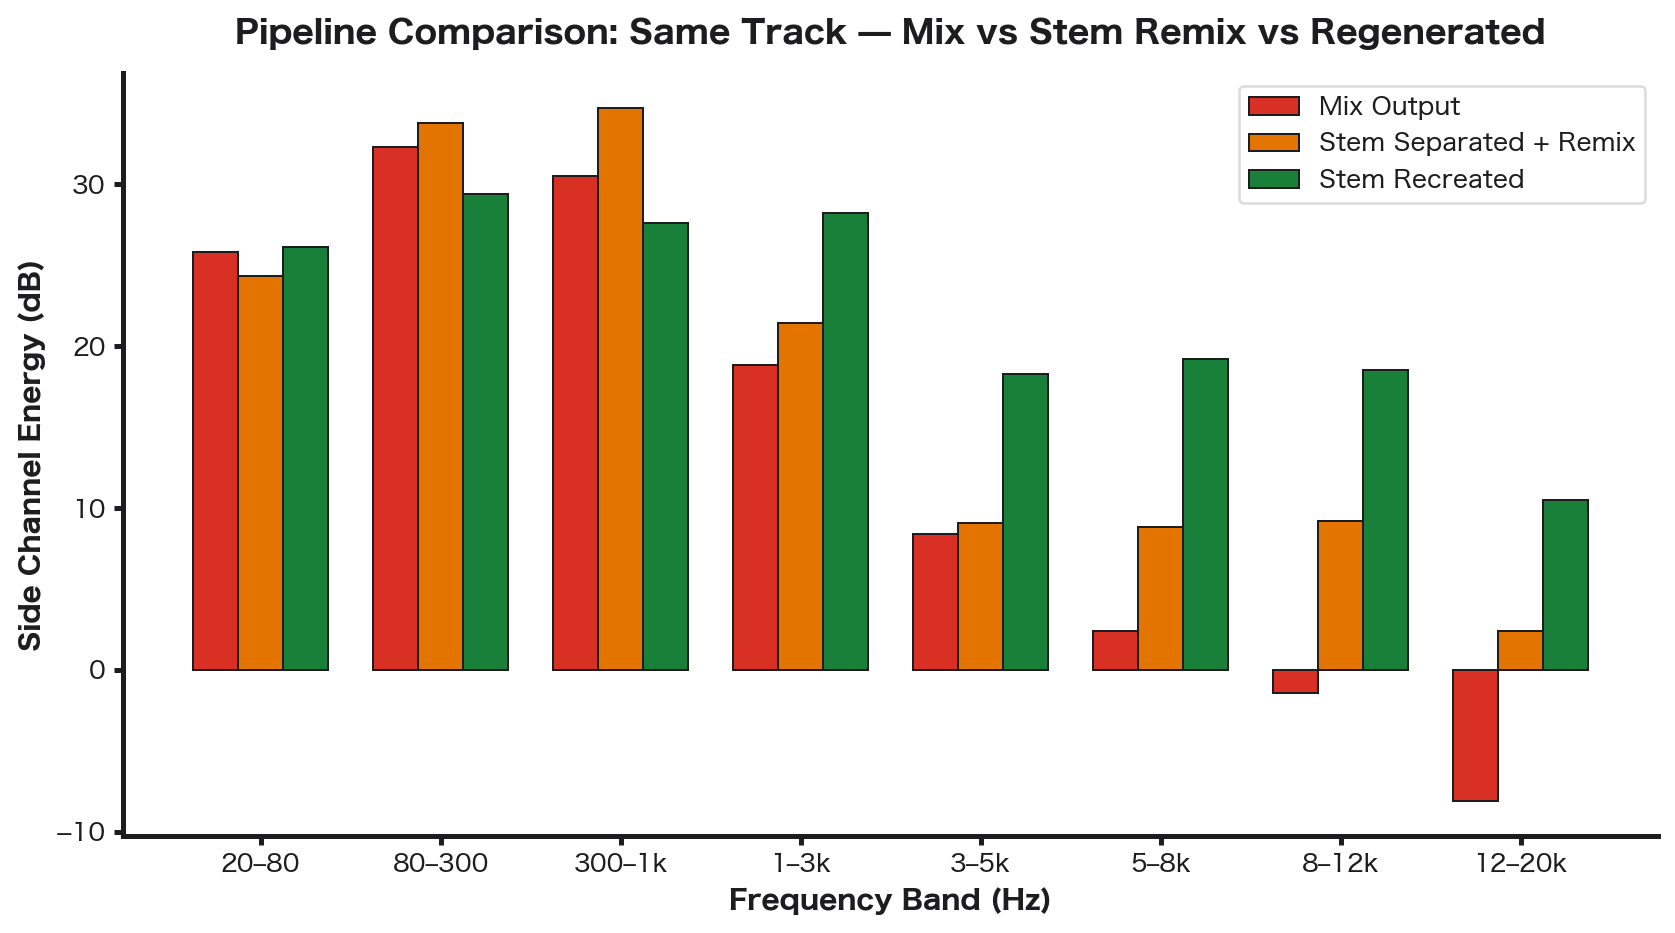
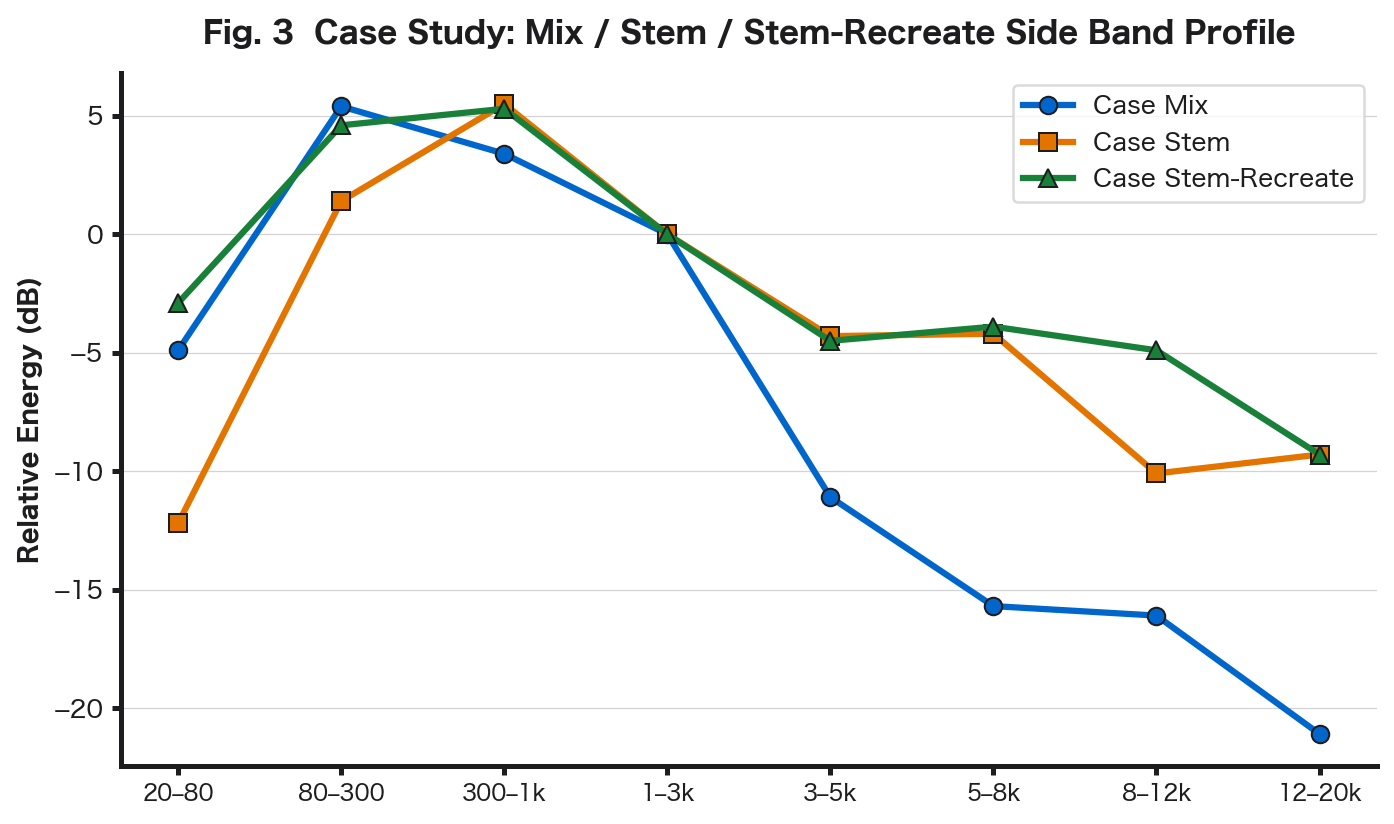
3.4 Pipeline Comparison: Three Output Stages from Same Track 【Fact】
Three output paths were compared for the same track:
| Output Path | Side/Mid Ratio | Side Rolloff | 5-8kHz | 8-12kHz | 12-20kHz |
|---|---|---|---|---|---|
| Direct mix-down export | -19.30 dB | 35.7 dB | 2.4 dB | -1.4 dB | -8.1 dB |
| Stem separated + remix | -17.27 dB | 46.4 dB | 8.8 dB | 9.2 dB | 2.4 dB |
| Stem recreated (regenerated) | -11.03 dB | 34.6 dB | 19.2 dB | 18.5 dB | 10.5 dB |
Note: Path 3 (“regenerated”) uses Suno’s Studio feature to individually regenerate each instrument stem. Due to Suno’s generative nature, regenerated stems may contain slight variations in phrasing and nuance compared to the original mix.
Principal finding: Paths 1 and 2 show nearly identical degradation patterns, while path 3 shows markedly improved quality. The 5–8kHz band shows +16.8 dB more Side energy in regenerated stems vs. direct mix. Stereo width is +8.27 dB wider.
This indicates that degradation is irreversibly applied to the audio data during the mix-down stage. Stem separation merely decomposes an already-degraded signal — lost information cannot be recovered. The improvement in path 3 is consistent with re-acquisition from pre-codec internal generation layers.

3.5 Corpus-Scale Figures
The following figures integrate the 3,571-track corpus analysis with the individual sample verification.
4. Technical Analysis
Note: This section contains evidence-based inferences and circumstantial hypotheses. Each is clearly labeled.
4.1 Neural Audio Codec Structure 【Inference】
Suno AI and other music generation AIs use internal neural audio codecs (EnCodec, SoundStream, or derivatives). These codecs employ encoder-decoder architectures with residual vector quantization (RVQ), trained with perceptual loss functions that prioritize the reconstruction of perceptually salient components.
For stereo audio, the Mid component carries higher perceptual importance and receives priority in bit allocation — the same design philosophy as MP3 joint stereo encoding. The Side channel high-frequency degradation in Suno output is rationally explained as a direct consequence of this codec architecture.
4.2 Stem vs. Mix Output Asymmetry 【Fact】
The three-stage pipeline comparison in Section 3.4 objectively confirms that stem and mix output paths diverge. The following pipeline structure is empirically demonstrated:
Internal Generation Layers (high resolution)
  ├── Stem output → Individual layers to WAV (pre-codec or light processing)
  └── Mix output  → Sum all layers → Neural codec → WAV container
4.3 Intentional Fingerprint Hypothesis 【Hypothesis】
The following circumstantial evidence suggests the Side high-frequency degradation may include intentional fingerprint design:
Evidence 1: Temporal correlation with WMG partnership — Warner Music Group and Suno announced a comprehensive partnership on November 25, 2025, explicitly including “downloads, quality and safety” as agenda items. An increase in compression artifacts was observed in the weeks preceding this announcement (author’s subjective assessment).
Evidence 2: Purposeful stem/mix asymmetry — The asymmetry aligns with a rational design: signing only outputs likely to be distributed as finished products, while preserving quality for production materials.
Evidence 3: Detection tool ecosystem — Multiple fingerprint detection tools targeting Suno output exist, identifying spectral characteristics in the 2–8kHz range. Suno has publicly acknowledged using proprietary inaudible watermarking technology.
Evidence 4: Label-side motivation — Major labels requiring traceability of outputs from models trained on their catalogs is a rational prerequisite for license enforceability.
4.4 WAV Container Semantics 【Fact】
A separate Suno output file analyzed earlier was recorded as PCM_16bit within a WAV container. The container format does not reflect the information content of data post-codec.
5. Industry Context
5.1 Warner × Suno Partnership Overview
The November 25, 2025 partnership includes: lawsuit settlement (RIAA copyright infringement suits by UMG/Sony/WMG), licensed next-generation models (current models to be deprecated in 2026), artist opt-in systems with compensation, download restrictions, and Suno’s acquisition of Songkick.
5.2 AI-Generated Content Distribution
The influx of AI-generated music onto streaming platforms is an industry-wide concern. The spectral characteristics of Suno output documented in this report may serve as a technical basis for automated detection.
6. Conclusions
Confirmed Facts
- Suno AI WAV mix output exhibits significant energy attenuation above 5kHz in the Side channel
- This attenuation is consistent across all Suno samples and absent from conventional DAW productions
- Side rolloff (38.6–42.2 dB) is consistent with MP3 128kbps joint stereo behavior
- Stem output does not exhibit this degradation
- WAV container bit depth does not reflect post-codec data quality
Reasonable Inferences
- Suno’s internal pipeline uses a neural audio codec (EnCodec-family), and Side high-frequency degradation is a structural consequence
- Stem and mix output paths differ, with codec application at different pipeline stages
Hypotheses Requiring Further Verification
- Part or all of the Side degradation may constitute intentional fingerprint design
- The WMG partnership’s traceability requirements may motivate this design
- This fingerprint may interface with distribution platform AI detection systems
This report is based on independent technical analysis. The author has no affiliation with Suno AI, Warner Music Group, or any other entities mentioned.